
Data-driven organizations are 19 times more likely to be profitable than less data-centric peers, according to Forbes-backed research cited by Berkeley Executive Education. That stat changes the conversation. Data driven decision making isn't a reporting exercise. It's a leadership discipline tied to growth, margin, and staying competitive when conditions shift.
Most companies don't fail because they lack dashboards. They fail because leaders still treat data as a side input instead of the operating system for decisions. Tools can surface patterns. Culture determines whether anyone acts on them.
The companies that make this stick do a few things differently. They ask better questions. They define what good data looks like before building models. They train managers to challenge assumptions, including their own. And when they need to accelerate behavior change, they bring in outside experts who can make abstract principles usable in a room full of executives, sales leaders, HR teams, and operators.
What Is Data-Driven Decision Making Really
Data driven decision making means choosing a course of action based on evidence you can inspect, test, and learn from, rather than relying only on rank, instinct, or habit. Instinct still matters. But it becomes informed intuition, not unchallenged opinion.
A simple analogy helps. A doctor doesn't diagnose from body language alone. They look at symptoms, then confirm with lab results, scans, and medical history. Business works the same way. A leader might sense that sales momentum is slipping or turnover is rising, but data tells you whether the cause is pricing, onboarding, manager behavior, lead quality, or something else entirely.
It's a culture shift, not a math contest
Teams often overcomplicate this. They assume data driven decision making requires everyone to become a statistician. It doesn't. It requires people to build the habit of asking:
- What problem are we solving
- What evidence do we already have
- What evidence is missing
- What would change our mind
That last question matters most. If no one can answer it, the organization isn't using data. It's decorating decisions after the fact.
Practical rule: If a team reaches the same conclusion no matter what the data says, the issue isn't analytics. It's governance and leadership.
The phrase sounds technical, but the actual shift is cultural. You are replacing "I think" with "This is what we know, this is what we don't, and this is how we'll test the next step."
The Real Business Impact of Data-Driven Decisions
The financial case is already strong. Organizations that fully quantify gains from big data analysis see an average 8% revenue increase and a 10% cost reduction, while 91% of businesses believe data driven decision making is critical to success, according to global statistics collected here.
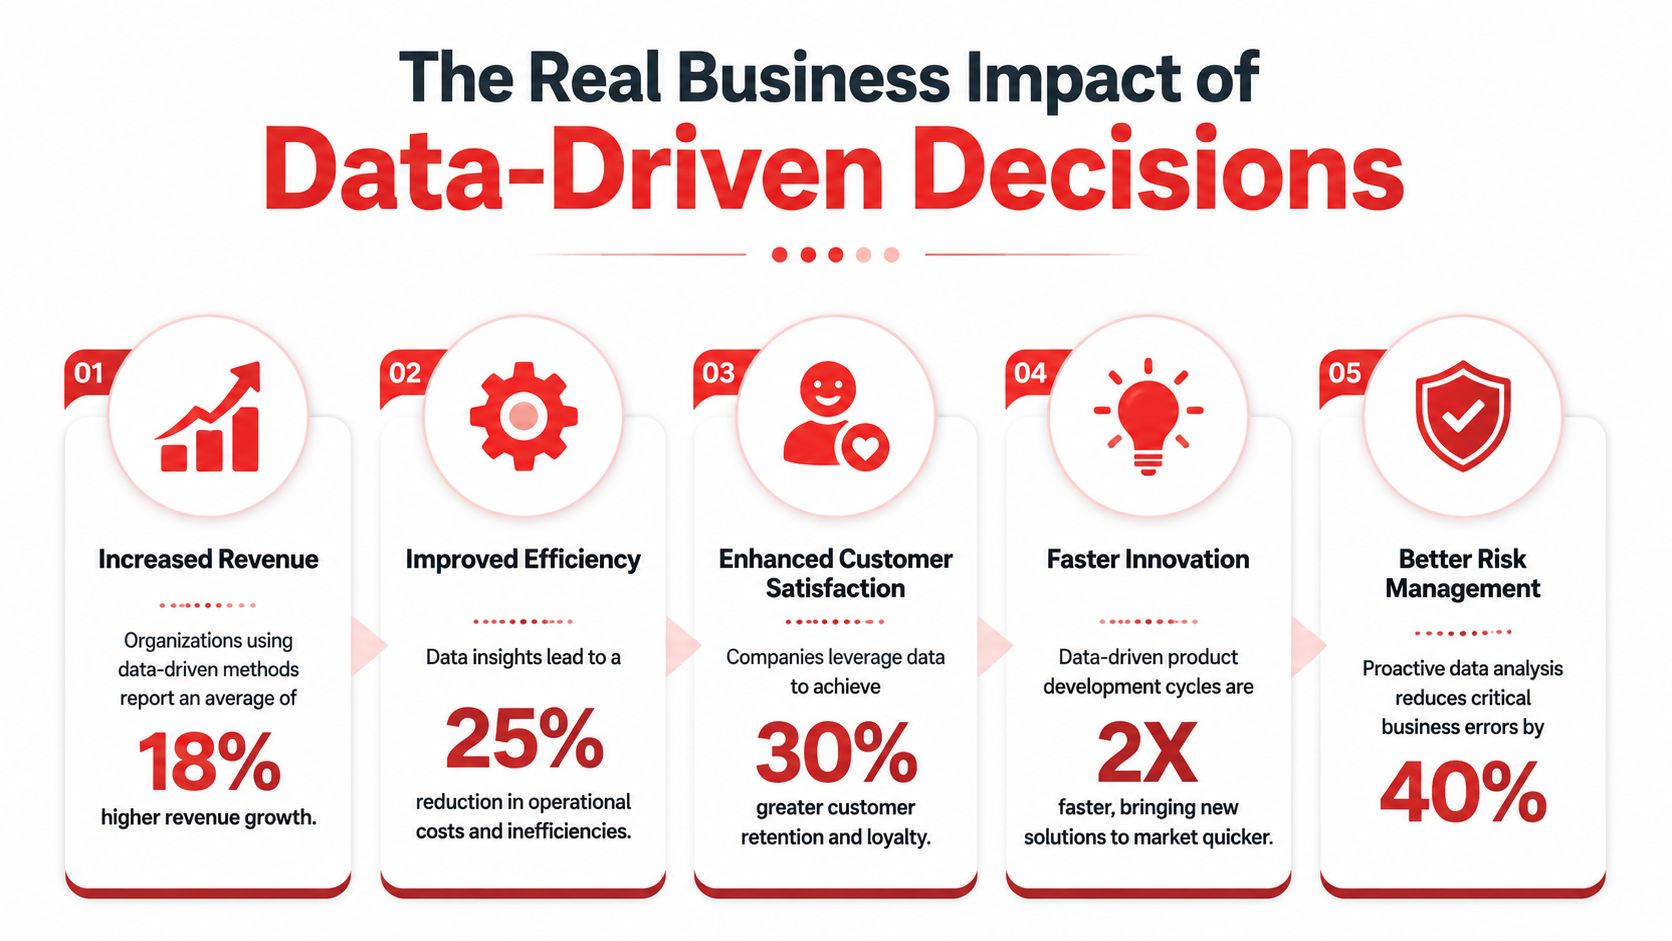
Those outcomes don't appear because a company bought a dashboard license. They happen because leadership teams start making better calls in places where money is won or lost. Pricing. Forecasting. Inventory. Marketing allocation. Hiring. Customer service handoffs.
Where the impact shows up first
The first wins are usually operational, not glamorous. A leadership team reviews sales pipeline data and notices one segment takes longer to close, but also expands faster after the initial contract. That insight changes how account executives prioritize effort. An operations team spots a repeat delay between handoff stages and fixes the process instead of blaming individuals. A marketing team sees that one campaign produces leads that stall after demos, while another produces fewer leads but better-fit buyers.
Here's the pattern:
| Business area | Gut-led approach | Data-led approach |
|---|---|---|
| Marketing | Spend follows the loudest opinion | Spend follows conversion signals and buyer behavior |
| Sales | Forecasts rely on optimism and anecdotes | Forecasts use stage movement and deal patterns |
| Operations | Teams react after bottlenecks hurt service | Teams watch process data and intervene earlier |
| Talent | Leaders guess why people leave | Leaders connect feedback, timing, and manager trends |
Why this becomes a competitive edge
A key advantage isn't just accuracy. It's speed with discipline. Leaders can act faster when they trust the evidence in front of them. Real-time platforms such as Power BI, Tableau, and Google Data Studio help teams adjust campaigns, offerings, and inventory quickly, according to this overview of real-time data tools and workflows.
AI also expands what leaders can do with that evidence. For teams evaluating how analytics and automation fit into planning, artificial intelligence in business is a useful practical lens.
Data creates leverage when it changes behavior, not when it creates more slides.
Companies often say they value evidence. The ones that outperform build routines around it.
A Simple Framework for Making Data-Driven Choices
Teams need a repeatable method more than they need another platform. In practice, the cleanest approach is a simple cycle: define the question, collect the data, analyze what it means, form a hypothesis, act, then measure and iterate. A structured HR example uses a problem like 90-day turnover spikes to move from symptom to root cause and then to intervention, as described in this six-step DDDM approach.
Start with the question. Not "What data do we have?" Ask, "What decision are we trying to make?" That one change saves teams from drowning in irrelevant reports.
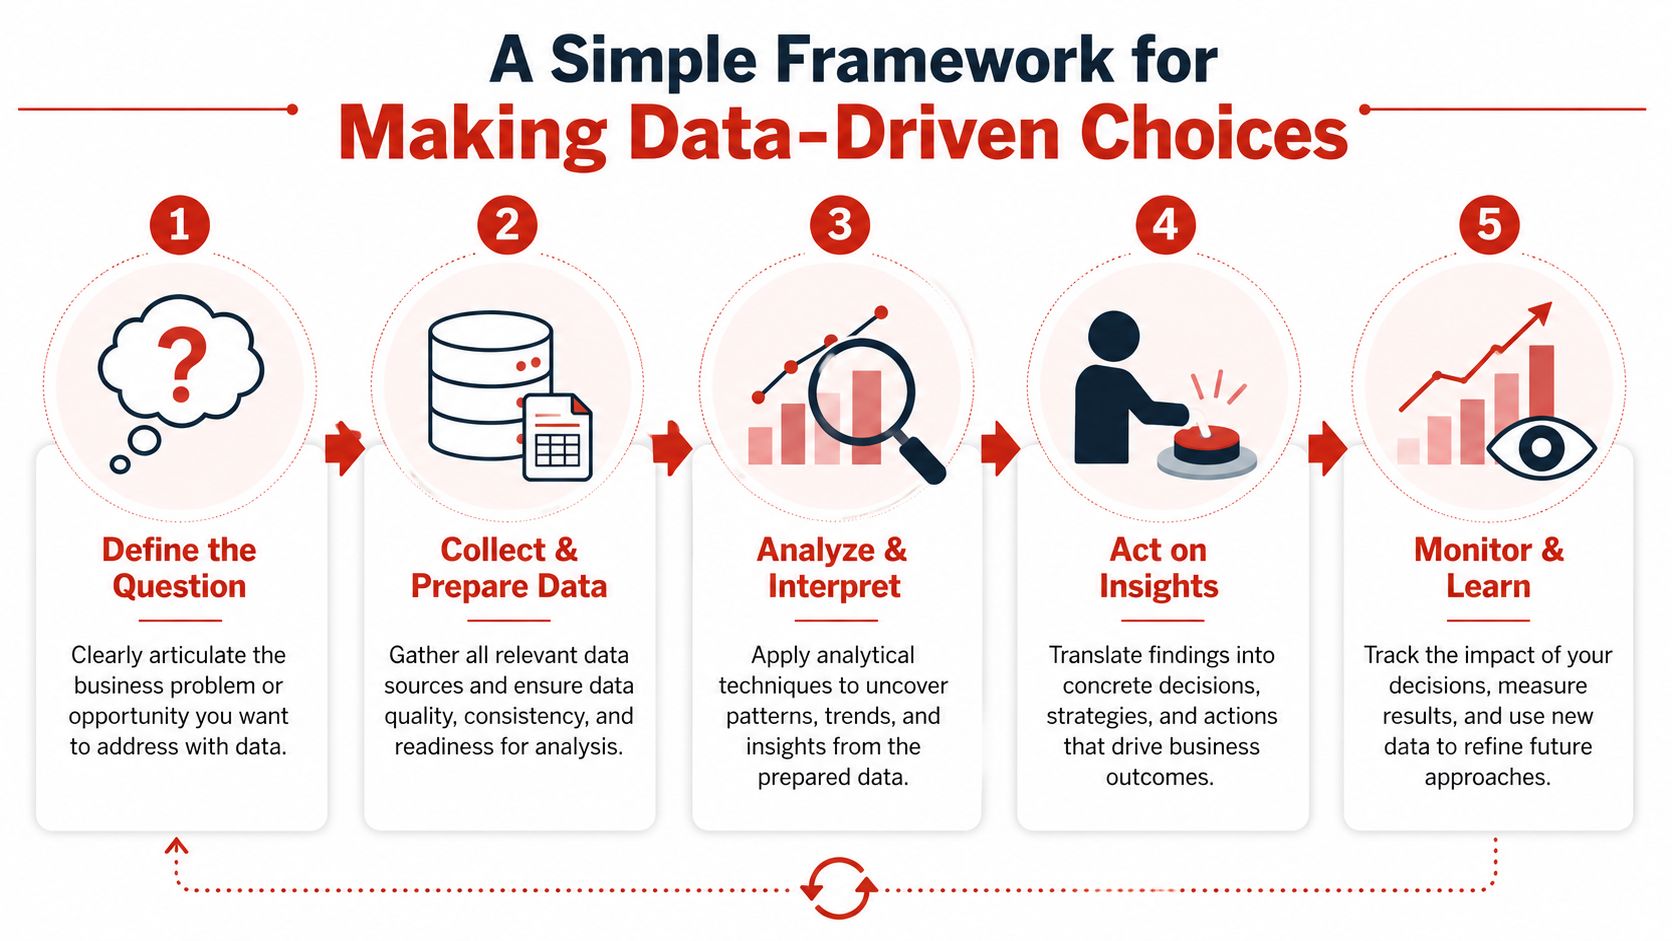
A six-step cycle leaders can actually use
Define the decision
Be precise. "Reduce churn" is too broad. "Find why enterprise customers stall after onboarding" is usable.Collect the relevant evidence
Pull the inputs that match the question. That may include CRM data, support tickets, onboarding milestones, survey feedback, or sales call notes.Clean and prepare the data
If definitions differ across teams, the analysis will mislead. Standardize terms before drawing conclusions.Analyze for patterns
Look for timing, segmentation, outliers, and repeated friction points. Through this process, teams often realize the original assumption was wrong.Form a hypothesis and act
Turn the pattern into a specific move. Example: revise onboarding touchpoints for one customer segment, rather than redesigning the whole program.Measure and iterate
Decide in advance what success looks like. Review results, then refine the next action.
A useful support tool here is data visualization for event professionals and teams, especially when you need leaders to see patterns quickly rather than decode spreadsheets.
One example from the field
Suppose customer success leaders believe product complexity is driving churn. The data might show something different. Maybe churn clusters around accounts that had delayed implementation kickoff calls. Maybe customers with low early feature adoption stay if they had strong executive sponsorship. Maybe support volume isn't the problem at all.
That is the value of the framework. It narrows debate.
For teams that want a visual walkthrough of how data decisions work in practice, this short video is a good complement to the process above.
How to Build a Data-Driven Organization
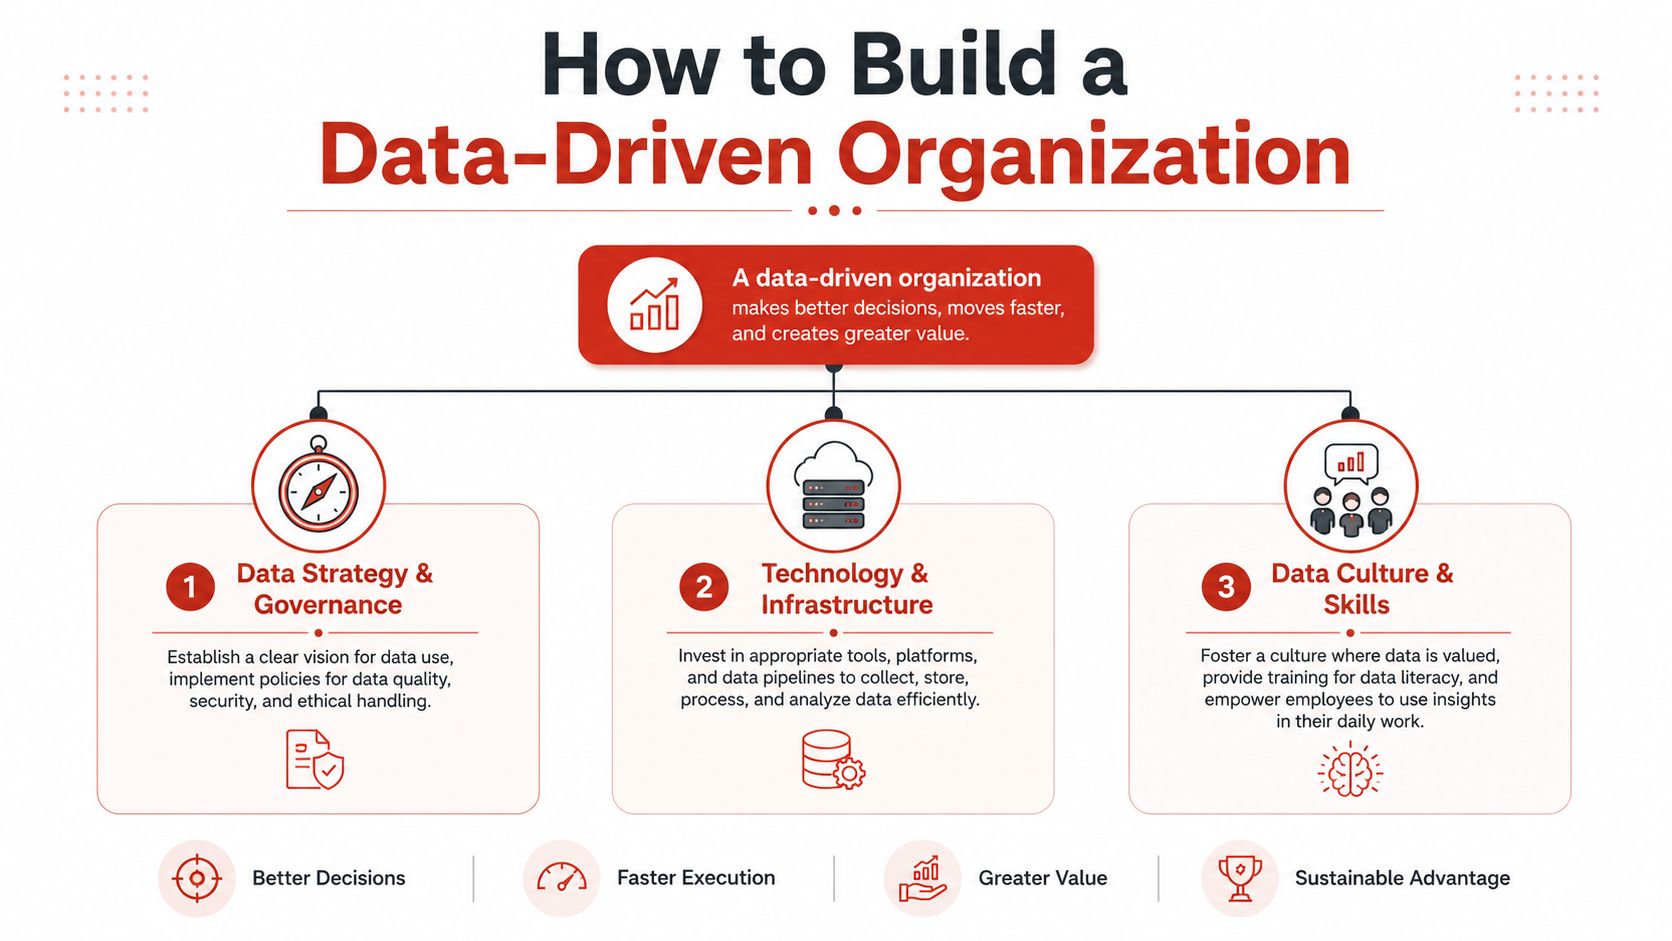
A company becomes data-driven when people, process, and technology reinforce one another. Remove one leg of that stool and the whole system wobbles. Plenty of firms buy strong tools and still struggle because no one agreed on definitions, no one trusts the data, or managers don't know how to use the outputs.
Effective implementation starts with governance. A Data Governance Committee should define measurable data quality standards such as accuracy, completeness, consistency, and timeliness, because those standards become the foundation for analysis and machine learning, as explained in this implementation guide.
People drive adoption
Culture lives in manager behavior. If leaders ask for evidence only when they disagree, teams learn to hide uncertainty. If leaders reward curiosity, people bring better analysis forward.
Build the people side with a few practical habits:
Train for decision literacy, not just tool literacy
Teams need to know how to frame questions, interpret trade-offs, and challenge weak conclusions.Make data discussion normal in meetings
Ask what changed, what supports the claim, and what signal would reverse the recommendation.Reward learning, not just being right
A test that disproves a bad assumption is progress.
Process turns intent into consistency
Process is where many transformations either become real or falter. Strong organizations define who owns each metric, where the source of truth lives, how often data is refreshed, and when a metric can be changed.
A short operating table helps:
| Pillar | What works | What fails |
|---|---|---|
| People | Managers model curiosity | Leaders weaponize data in reviews |
| Process | Clear metric ownership and governance | Different departments use different definitions |
| Technology | Tools fit the decision workflow | Tools become shelfware because no one changes habits |
Technology should simplify, not intimidate
Technology matters, but it isn't the hero. The right setup lets teams gather, visualize, and act without creating extra friction. Dashboards should answer live business questions. Alerts should point to meaningful exceptions. AI should reduce ambiguity, not add a black box no one trusts.
The best data stack is the one your operators will actually use on a Tuesday afternoon.
Keep the sequence in order. Define decisions first. Then governance. Then workflow. Then tools.
Common Pitfalls That Derail Data Initiatives
The obvious failure mode is bad data. The more dangerous one is when leaders use data language while keeping old decision habits. That creates a polished version of guesswork.
A major example is the paradox of data-induced confirmation bias. Leaders selectively interpret evidence to support a view they already hold, even though data should be helping them challenge assumptions. One warning sign is that only 57% of organizational data is used for intelligent decisions, as discussed in this analysis of data use and cherry-picking.
Five traps I see repeatedly
Starting without a decision in mind
Teams gather a mountain of reports and still can't answer the core business question.Confusing visibility with clarity
More dashboards don't automatically mean better decisions. Sometimes they just spread attention thin.Cherry-picking the metric that supports the loudest executive
This is politics in spreadsheet form.Treating disagreement in reports as a technical nuisance
When revenue, pipeline, and finance numbers conflict, you have a governance issue. Teams need a repeatable way to resolve conflicting data reports before they make strategy calls.Ignoring communication
If analysts can't explain the finding in plain business language, the work won't influence action.
What to do instead
Use a counterweight for each failure mode.
| Pitfall | Antidote |
|---|---|
| No clear objective | Define the decision before the analysis starts |
| Confirmation bias | Ask what evidence would disprove the favored view |
| Analysis paralysis | Set a decision deadline and minimum evidence threshold |
| Siloed reporting | Create one agreed source of truth for core metrics |
| Poor storytelling | Translate findings into operational choices and trade-offs |
If two departments can show different numbers for the same question, the leadership team doesn't have an insight problem. It has a trust problem.
The fix isn't perfection. The fix is disciplined interpretation.
Leading the Change Toward a Data-First Culture
Data driven decision making becomes durable when leaders change what gets asked, rewarded, and repeated. This isn't an IT rollout. It's a management reset.
Leaders set the tone in ordinary moments. A pipeline review. A postmortem. A budget conversation. If executives ask for evidence only when performance drops, teams will treat data as a defense mechanism. If they ask for evidence in planning, prioritization, and learning, teams start using it as a steering mechanism.
What a data-first leader actually does
A data-first leader doesn't pretend numbers answer every question. They create a pattern of disciplined inquiry.
That usually looks like this:
They ask sharper questions
"What does the data say?" is a start. Better questions are "What changed?", "What's the strongest counterpoint?", and "What are we assuming that hasn't been tested?"They model curiosity in public
When a leader says, "I thought X, but the data suggests Y," it gives the whole team permission to update its view.They make room for uncomfortable findings
Teams need psychological safety to surface evidence that challenges a senior person's preferred story.
Culture changes through repeated signals
A company doesn't become data-first because of a memo. It changes because leaders build routines. Weekly business reviews that focus on decision quality, not just outcomes. Planning meetings that separate facts from assumptions. Retrospectives that examine why a call was made, not just whether it worked.
Three habits matter more than most:
Separate signal from status
The best idea shouldn't need the most senior sponsor to survive.Treat failed experiments as useful evidence
If a team ran a sound test and the result disproved a belief, that is not waste. That is learning purchased cheaply.Tie data use to operating cadence
If data discussion only appears in quarterly presentations, it won't influence daily execution.
Leaders don't need to have all the answers. They need to make evidence harder to ignore than hierarchy.
One practical observation from change work. Teams rarely resist data itself. They resist the loss of familiar authority. A sales leader who built a career on instinct may feel threatened by new evidence. A tenured operator may hear measurement as mistrust. Good leaders address that directly. They explain that data isn't replacing judgment. It's sharpening it.
The most effective executives also know when to bring in outside voices. An external keynote speaker or workshop facilitator can compress months of internal debate into one session if they have real operating credibility. The key isn't inspiration alone. It's helping leaders see what disciplined decision culture looks like in action, from people who've built products, scaled teams, or led through uncertainty.
Planning Your First Data-Driven Leadership Workshop
Many companies know they need a stronger decision culture but struggle to make it real. That's where a focused workshop helps. It gives leaders shared language, exposes weak habits, and turns an abstract priority into concrete behaviors.
A common problem is proving the value of that kind of session. A major challenge for planners is that most data driven decision making content still doesn't offer a clear way to translate workshop outcomes into metrics leadership cares about, as discussed in this review of the ROI shortfall for leadership workshops.
Start with the decision problem, not the event format
The best workshop briefs are business briefs. Don't start with "We need a keynote on data." Start with the underlying need.
For example:
- Sales leadership team needs to reduce forecast subjectivity
- HR and L&D need managers to use evidence in retention and engagement decisions
- Executive team needs better cross-functional planning under uncertainty
- Product and operations need a shared method for testing assumptions
That diagnosis tells you whether you need a keynote, a half-day workshop, or a working session with a small leadership group. If you're comparing formats, corporate workshops can help frame what works best for skill building versus inspiration.
A workshop structure that works
A practical agenda usually includes a mix of concept, application, and reflection.
Module one: Moving from gut feel to informed intuition
Show how strong leaders use experience and evidence together. This lowers resistance because it doesn't insult judgment.
Module two: Asking better business questions
Most poor analysis starts with a vague question. Teach leaders how to define the decision, not just request more data.
Module three: Reading data without overreacting
Help managers distinguish between meaningful patterns, noise, and vanity metrics.
Module four: Storytelling with data
Teams need to present a recommendation, the supporting evidence, the trade-offs, and what would change the conclusion.
Module five: Commitments by team
Each group leaves with one decision ritual to adopt, one metric to clarify, and one assumption to test.
How to use an external expert well
Outside speakers are most effective when they do more than inspire. Choose someone who has built with data under real constraints. That might be an AI pioneer, a founder with patents and operating experience, or a leadership voice who can connect performance, learning, and decision quality.
What works:
Real stories of judgment calls
Audiences learn more from trade-offs and mistakes than from polished theory.Specific operating examples
Product launches, hiring calls, customer pivots, and failed bets make the ideas usable.Interactive application
Build in exercises where leaders test a live decision from their own business.
What doesn't work:
- Abstract futurism with no operating relevance
- Generic motivation without tools
- A one-off talk with no follow-through
To measure ROI, define outcomes before the session. Track whether leaders changed meeting habits, clarified metric ownership, improved how they frame decisions, or increased the use of evidence in planning reviews. The point isn't to force fake precision onto every soft outcome. It's to connect learning to observable behavior.
A strong workshop doesn't make everyone analytical overnight. It gives leaders a better standard for how decisions should happen, and a shared commitment to practice it.
If you're planning a keynote or workshop that helps leaders turn data into better judgment, Silicon Valley Speakers connects organizations with builders, inventors, and operators who've made high-stakes decisions in their fields. Their curated roster includes voices in AI, innovation, leadership, and the future of work who can help your team move from theory to execution.